

Data Quality Reporting is one of those practices that can be more harmful if done badly than not done at all. At this very moment there will be many thousands of operational people and executives who incorrectly believe that their data is in good shape due to unintentionally bad quality reporting. They are not even thinking about fixing it as they have no idea that there is a problem.
Data Quality is not the most exciting topic on the management agenda. This is particularly true of Customer Data where the stakeholders are more interested in sales targets, marketing campaigns and the latest creative, digital techniques. But Customer Data Quality has a huge impact on selling and marketing success as well as a direct impact on the Customer Experience. In fact, the criticality of high quality customer data is increasing as organisations move towards more programmatic media selection, personalised content and increasingly digital channels.
In my experience most organisations do have a measure that they can point to and claim to be monitoring data quality on an ongoing basis. In reality what most have is a set of simple counts of the percentage of key fields that are populated with something. This is mainly used to beat up the people responsible for capturing the data and only applies to data on its way into systems, not to the overall base of customer data.
This article brings together a number of the measures that I have designed for clients to use or at least recommended that they monitor. I couldn’t point to a single client who has implemented the whole set but there are a number that are getting close and that appear to be reaping the rewards.
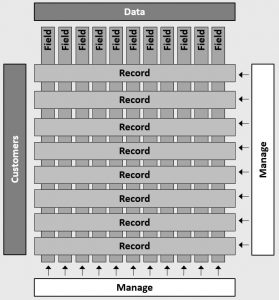
A basic principle – Measures are needed for Records as well as Fields
Measuring the quality of population of individual data fields is a critical part of any data quality framework but it is, at best, half of the task. Although it would be an extreme set of circumstances an organisation could have 50% of records populated with a valid email address and 50% of populated with first names. If they are different 50%’s then they have zero records that can be used for a personalised email. An extreme illustration but it does make the point.
The other critical factor in measuring the quality of records as well as fields is that it makes the exercise customer-centred rather than being purely data-centred. I would therefore suggest that as a minimum any data quality framework needs measures by field and by record so that is the way that my proposed ‘great’ set of measures works.
Field-by-Field Quality Measures
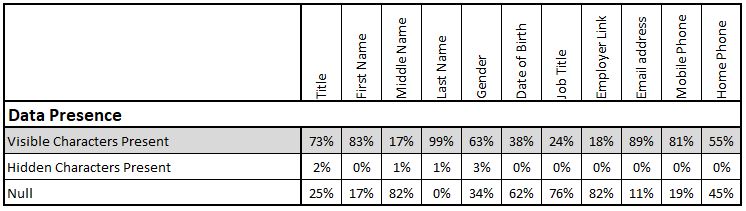
Data Presence
This is the start point for all data quality measurement but is also, all too often, the end-point. Even this simplistic measure – How many records have got something in this field? – is not as simple as it would seem. Even after 20 years experience I am sometimes caught out by the fact that a field can be populated with blank characters. This results in simple data counting queries believing a field is populated when a human can easily tell that it is empty.
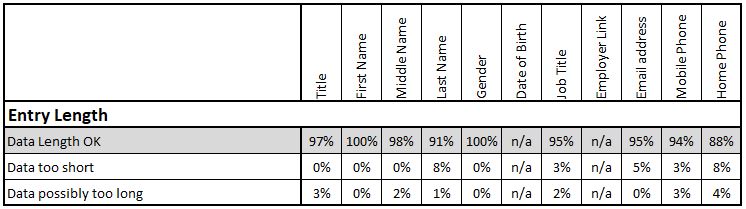
Entry Length
Many data types can have a minimum character length attributed to them and this can be easily checked by simple queries. Phone Numbers, Postcodes, Dates of Birth all have a clearly defined minimum length, although these standards can vary across international boundaries. Name fields also often have minimum lengths although extreme care is required with names in a multi-cultural customer base. The challenge with entry length standards is in identifying when an entry is too long and has been truncated in inputting or feeding it into the database. Hopefully this will have been trapped by checks at the capture point but experience has shown that, for certain data types, at least 80% of records that are the maximum length of the field are actually truncated
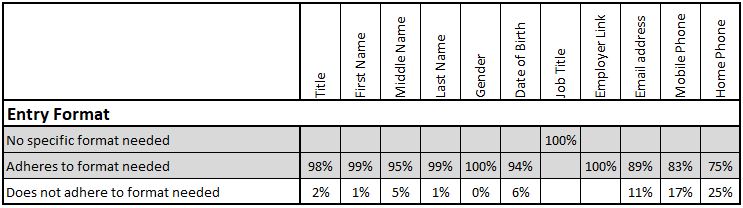
Entry Format
Data needs to be of the right format for the field in which it is entered. Many customer databases will have new records checked for format when they are loaded. For instance, a phone number can only be numbers (and possibly a “+” symbol), an email address has a clearly understood format requirement and even international VAT Numbers follow a known pattern. Formats need to be individually defined for many fields and any checking carried out against these field-specific definitions.
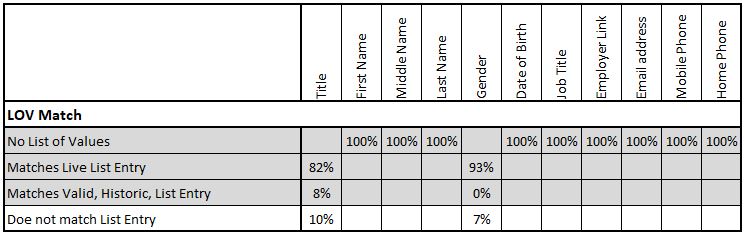
Match to a List of Values (LOV)
Some data needs to match to a list of acceptable values to be considered as properly populated. The values will at least replicate those offered at the point of data capture but for quality measurement may also include old values which are still meaningful but are no longer offered at point of input. It is usually valuable to identify which of these cases applies in the quality reporting.
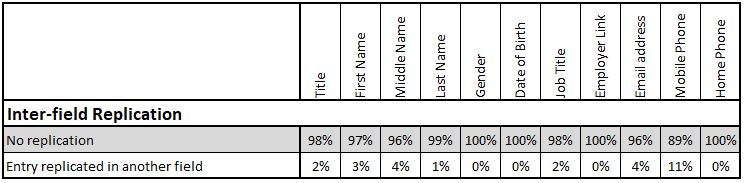
Inter-field replication
This is a less-used measure but can add substantial value for a small amount of extra effort. Some data replication will be identified by the previous measures. For instance, an entry like (Mr, Mrs, Ms etc.) in the First Name field may be caught by the format check on that field. But it may not be caught, whereas in a data replication check it is more likely to be identified. In a Business-to-Business situation entry replication can often be identified between fields such as Company Name and Trading Name.
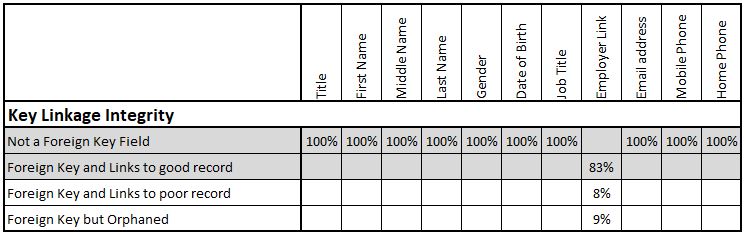
Key Linkage Integrity
This is a more advanced measure but potentially one of the most important. In relational databases the whole concept is to avoid storing data multiple times. So, if the database stores 5 people who live at the same address or 50 people who work at the same company then it gives each address or company a reference number and then only stores this reference number (foreign key) for each person. As an absolute minimum the quality measurement should check that this foreign key refers to an address or company that still exists. Ideally it should also identify whether the linked records is a good quality record or not. It is of little value having a customer linked to an address which is not mailable or to a company with the name of “aaaaa”.
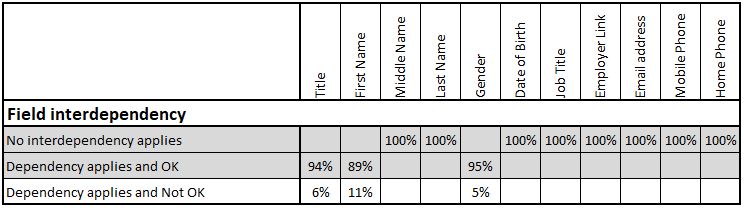
Field Interdependency
The values in some fields should work in conjunction with those in other fields, or at least not conflict with them. A gender of “M” should not be in the same record as a salutation of “Ms.”. A company called “Industries plc” should not appear in a record with an enterprise type of “Partnership”. Individual checks, and sometimes more than one, are required for each field and the corrective action is not always obvious from a record failing one of the checks. Sometimes the check is for specific values but sometimes just a simple data presence check is needed. For instance, a ‘Date of Death’ should not appear unless a customer status is deceased.
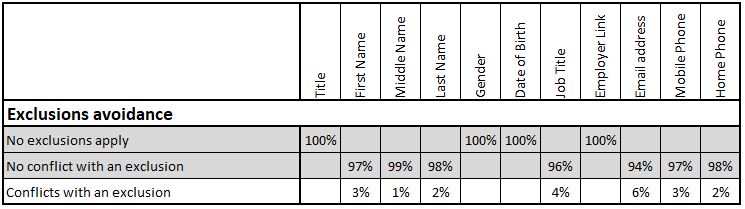
Exclusions Avoidance
This measure is, to some extent, a mopping-up measure designed to identify spurious values in fields based on growing experience of the invalid entries that customers or staff provide. It involves comparison against a regularly maintained exclusions list for each relevant field. Examples of exclusions for phone numbers may include widely advertised numbers that stick in people’s minds. Examples of exclusions for names would include the organisation’s standard profanity and offensiveness checks as well as certain famous names.
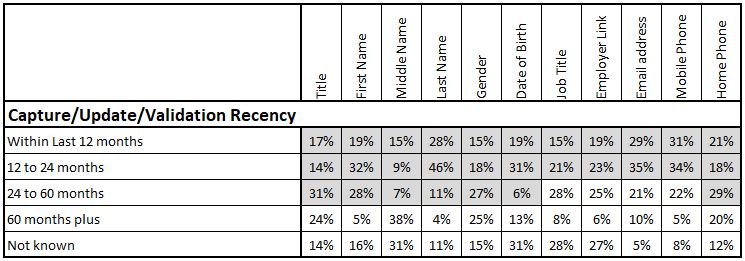
Capture/Update/Validation Recency
The ability to implement this measure at a field level is rare. It requires that “Date-of-last-change” or a similar attribute is stored against each field as opposed to being stored once for a record. The audit functions of some CRM systems and Customer Databases provide this facility but turning it on can impact performance. There is an increasing focus on recording more granular ‘last-change’ or ‘last validation’ data, especially where it impacts the requirements of privacy and data protections legislation like GDPR in Europe.
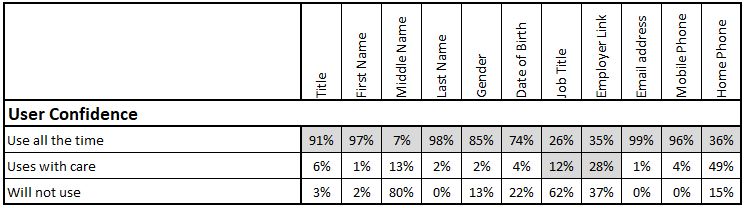
User Confidence
This measure is also rarely seen but is extremely insightful. It relies on a research approach among users of the data. This is normally relatively small scale and not overly formal. It may be done as screen pop-ups inviting / requiring users to score their level of confidence in data that they are accessing at the time. The measure can help identify the user communication activity that needs to accompany data improvement work in order to maximise its value.
Record-by-Record Quality Measures
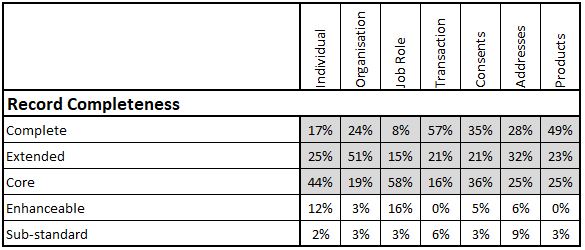
Record Completeness
This is the core measure at the Record Level. It requires the definition of a number of levels of completeness for each type of record being managed. Typically, there will be three to five levels, often including:
- Complete, where all fields are populated to the quality levels from the previous section
- Extended, where key value-added fields over and above ‘Core’ are populated
- Core, where all the basic fields necessary for the record to support business processes are populated
- Enhanceable, where the record cannot currently be used but could be enhanced to enable its use
- Sub-Standard, the record should be deleted or archived as appropriate
The proportions of records measured at each of these levels is the key indicator of the overall ‘health’ of each data table.
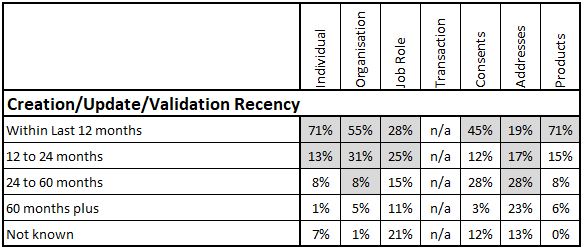
Creation/Update/Validation Recency
Most databases record when individual records are created or updated and the time elapsed since these events happening normally forms the core of this measure. Ideally the organisation also needs to store the date on which at least the key fields were validated with / by the customer. This is sometimes achieved by specific contact activity to check details with customers. In other situations it can be derived from other triggers such as the successful delivery of a posted communication which validates an address. Another example would be the creation of a service case on a product holding which validates that the holding is still current.
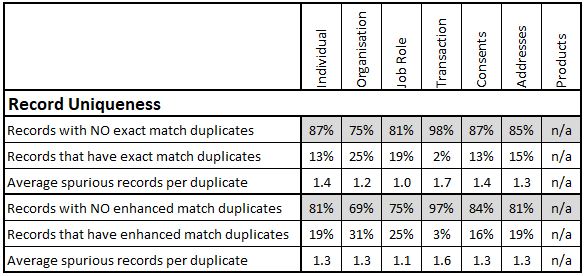
Record Uniqueness
This is effectively a measure of duplication levels in the tables of the database. The mechanisms for identifying duplicates warrant a whole article on their own. They can vary from simple ‘exact match’ measures to measures based on sophisticated ‘fuzzy’ algorithms. As the sophisticated matching activity can be time-consuming and expensive to achieve I have often recommended having a simple, frequent exact match measure and a periodic, enhanced measure.
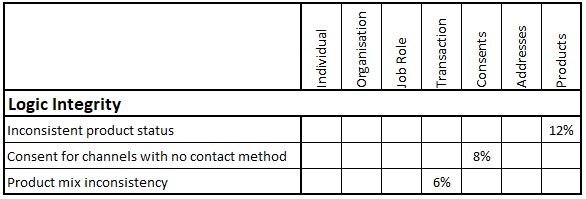
Logic Integrity
This is getting into the outer-reaches of typical data quality monitoring and is normally limited to detecting very specific quality challenges. An example for a Motor Manufacturer would be detecting where the same Product (Vehicle) had been sold to multiple customers with a ‘Vehicle Status’ of “New”. An example for an organisation that leases business equipment would be detecting where customers had apparently received service visits on equipment that they are not leasing. These rules would normally be individually defined and probably individually reported as in the example.


0 Comments